
EVALUATION
- Calculate to 1 d.p the mean and standard deviation of the following numbers:
- 5, 7, 12, 10, 5, 15, 14, 9, 7, 8
- 6.5, 8.5, 6.5, 8.4, 6.9, 2.5, 6.2, 5.5
GENERAL EVALUATION
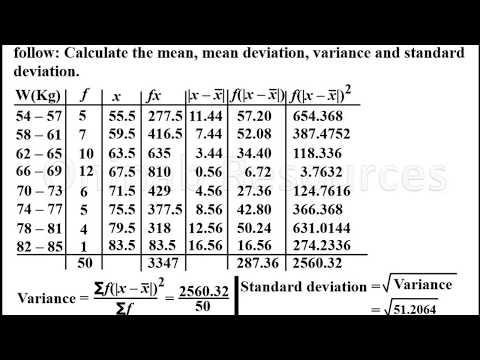
- The table bellows shows the age distributions of a group of people.
| Age (yrs) | 20 – 29 | 30 – 39 | 40 – 49 | 50 – 59 | 60 – 69 | 70 – 79 |
| Frequency | 3 | 5 | 10 | 13 | 7 | 2 |
Calculate:
- The mean age
- The variance
- The standard deviation
READING ASSIGNMENT
Essential Mathematics for Senior Secondary 1 pgs 237 – 248
WEEKEND ASSIGNMENT
- The lowest temperatures of a city in Asia for 10 consecutive days are recorded as: – 5oC, – 6oC, -5oC, 4oC, 0oC, 1oC, 2oC, 3oC, 4oC, 7oC. Find the mean deviation. A. 3.9 B. 4.0 C. 3.6 D. 6.4
Use the table below to answer question 2 to 4
A dice is thrown 100 times. The results are recorded as shown in the following table
| Score | 1 | 2 | 3 | 4 | 5 | 6 |
| Frequency | 15 | 18 | 17 | 21 | 14 | 15 |
Calculate:
- The mean score A. 4.0 B. 3.5 C. 1.0 D. 5.6
- The variance A. 2.7 B. 3.7 C. 2.1 D. 1
- The standard deviation A. 4 B. 5.1 C. 1.6 D. 7
- Find the variance of x, 2x, 3x, 4x, 5x, 6x, 7x, 8x, 9x and 10x. A. 8.25x29x2 B. 10x2 7.25x2
THEORY
- The shoe sizes of a group of people are as follows:
| Shoe size | 5 | 6 | 7 | 8 | 9 | 10 | 11 | 12 | 13 |
| Frequency | 3 | 8 | 14 | 16 | 20 | 10 | 5 | 3 | 1 |
For this distribution, calculate the mean deviation
- The table below show the age distributions of a group of people.
| Age (yrs) | 20 – 29 | 30 – 39 | 40 – 49 | 50 – 59 | 60 -69 | 70 – 79 |
| Frequency | 3 | 5 | 10 | 13 | 7 | 2 |
Calculate (a) the mean age (b) the variance (c) the standard deviation
Read our disclaimer.
AD: Take Free online baptism course: Preachi.com


Free Science simulations at Classadapt (UK) Classadapt.com