
Frequency Table:
When data has a large number of values, it is cumbersome to prepare its frequency table; hence the data are organized into classes or groups to overcome this problem. E.g 0 – 4, 5 – 9, 10 – 14 e.t.c.
The range of the classes is first considered before we group the data. When data is divided into groups, it is called a grouped frequency distribution.

Cumulative Frequency Table:
This is the table that shows the cumulative frequency of each of the classes and it is the running total of the frequencies class by class, giving the total frequency.

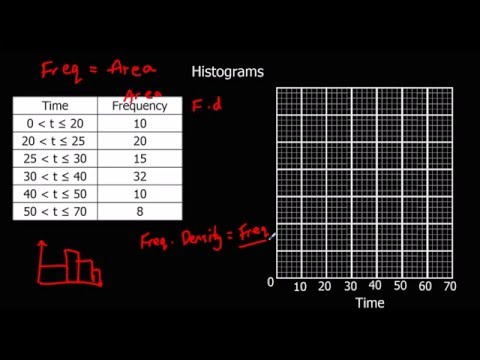
HISTOGRAM
This is a type of bar chart, each bar corresponding to one mark and with its length proportional to the frequency of that mark. The class marks or centres, class boundaries can be used on the variable scale. In histogram, the bars are joined together and must be of equal width, except when dealing with unequal class interval.
READING ASSIGNMENT
New General Mathematics SSS1, page 180, exercise 14e, numbers 2,3,4 and 7.
WEEKEND ASSIGNMENT:
1. The thickness of 20 samples of steel plate are measured and the results (in mm) to two significant figures are as follows:
7.3 7.1 6.6 7.0 7.8 7.3 7.5 6.2 6.9 6.7
6.5 6.8 7.2 7.4 6.5 6.9 7.2 7.6 7.0 6.8
Construct a table showing the following columns: class interval, class boundary, class mark, frequency and cumulative frequency, using class interval 6.2 – 6.4, 6.5 – 6.7 e.t.c
2. The following table shows the distribution of the masses of 120 logs of wood, correct to the nearest kg.
| Masses (kg) | 15 – 24 | 25 – 34 | 35 – 44 | 45 – 54 | 55 – 64 |
| Frequency | 14 | 54 | 24 | 26 | 2 |
- Draw a histogram for the distribution.
Read our disclaimer.
AD: Take Free online baptism course: Preachi.com


Free Science simulations at Classadapt (UK) Classadapt.com