We can solve a quadratic equation by factoring, completing the square, using the quadratic formula or using the graphical method.
Compared to the other methods, the graphical method only gives an estimate to the solution(s). If the graph of the quadratic function crosses the x-axis at two points then we have two solutions. If the graph touches the x-axis at one point then we have one solution. If the graph does not intersect with the x-axis then the equation has no real solution.
We will now graph a quadratic equation that has two solutions. The solutions are given by the two points where the graph intersects the x-axis.
Example:
Solve the equation x2 + x – 3 = 0 by drawing its graph for –3 ≤ x ≤ 2.
Solution:
Rewrite the quadratic equation x2 + x – 3 = 0 as the quadratic function y = x2 + x – 3
Draw the graph for y = x2 + x – 3 for –3 ≤ x ≤ 2.
| x | –3 | –2 | –1 | 0 | 1 | 2 |
| y | 3 | –1 | –3 | –3 | –1 | 3 |
The solution for the equation x2 + x – 3 can be obtained by looking at the points where the graph y = x2 + x – 3 cuts the x-axis (i.e. y = 0).
The graph y = x2 + x – 3, cuts the x-axis at x = 1.3 and x = –2.3
So, the solution for the equation x + x –3 is x = 1.3 or x = –2.3.
Recall that in the quadratic formula, the discriminant b2 – 4ac is positive when there are two distinct real solutions (or roots).
Graphing Quadratic Equations
ax2 + bx + c + 0
A Quadratic Equation in Standard Form, (a, b, and c can have any value, except that a can’t be 0.)
is an example:
5x2 – 3x + 3 = 0
Graphing
The simplest Quadratic Equation is f(x) = x2
And its graph is simple too:
This is the curve f(x) = x2, It is a parabola.
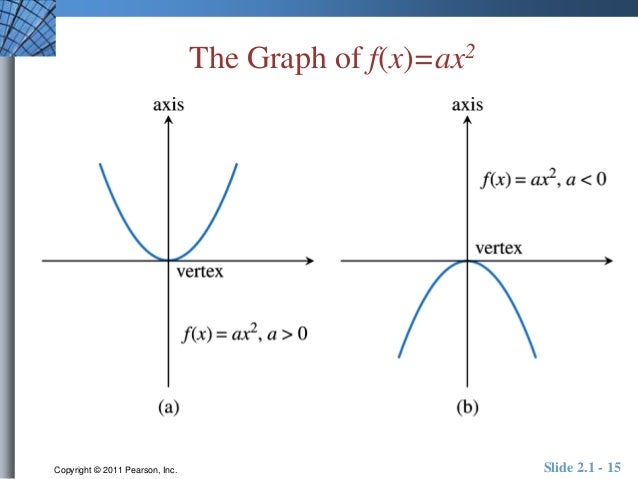
Now let us see what happens when we introduce the “a” value: f(x) = ax2

Let us see an example of how to do this:
First, let’s note down:
a = 2, b = -12, and c = 16
Now, what do we know? a is positive, so it is an “upwards” graph (“U” shaped), a is 2, so it is a little “squashed” compared to the x2 graph
Next, let’s calculate h:
h = -b/2a = -(-12)/(2×2) = 3
And next we can calculate k (using h=3):
k = f(3) = 2(3)2 – 12·3 + 16 = 18-36+16 = -2
So now we can plot the graph (with real understanding!):

Assessment:
Read our disclaimer.
AD: Take Free online baptism course: Preachi.com 