Linear Inequality (Graphical Representation)
Inequalities with one variable can be plotted on a number line, as in the case of the inequality x ≥ -2:

Here is another representation of the same inequality x ≥ -2, this time plotted on a coordinate plane:

On this graph, we first plotted the line x = -2, and then shaded in the entire region to the right of the line. The shaded area is called the bounded region, and any point within this region satisfies the inequality x ≥ -2. Notice also that the line representing the region’s boundary is a solid line; this means that values along the line x = -2 are included in the solution set for this inequality.
By way of contrast, look at the graph below, which shows y < 3?

In this inequality, the boundary line is plotted as a dashed line. This means that the values on the line y = 3 are not included in the solution set of the inequality.
Notice that the two examples above used the variables x and y. It is standard practice to use these variables when you are graphing an inequality on a (x, y) coordinate grid.
Two Variable Inequalities
There’s nothing too compelling about the plots of x ≥ -2 and y < 3, shown above. We could have represented both of these relationships on a number line, and depending on the problem we were trying to solve, it may have been easier to do so.
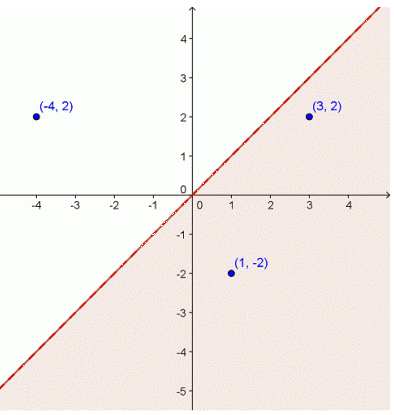
Things get a little more interesting, though, when we plot linear inequalities with two variables. Let’s start with a basic two-variable inequality: x > y.

The boundary line is represented by a dotted line along x = y. All of the points under the line are shaded; this is the range of points where the inequality x > y is true. Take a look at the three points that have been identified on the graph. Do you see that the points in the boundary region have x values greater than the y values, while the point outside this region do not?
Plotting other inequalities in standard y = mx + b form is fairly straightforward as well. Once we graph the boundary line, we can find out which region to shade by testing some ordered pairs within each region or, in many cases, just by looking at the inequality.
The graph of the inequality y > 4x − 5.5 is shown below. The boundary line is the line y = 4x − 5.5, and it is dashed because our y term is “greater than,” not “greater than or equal to.”

Graph of Cartesian plane (the axis)
Finding the location of (5, 2) and then drawing its dot is called “plotting the point (5, 2)”.
When plotting, remember that the first number is for the horizontal axis and the second number is for the vertical axis. You always go “so far over or back” and then “so far up or down”.
| I will start at the origin: |
| …then I’ll count over four units on the horizontal x-axis: |
| …then I’ll count down five units paralell to the y-axis: | |
| …and then I’ll draw my dot: |
As you can see above, a negative y-coordinate means that you’ll be counting down the y-axis, not up.
For Images – Copyright © Elizabeth Stapel 2000-2011 All Rights Reserved
| I’ll start at the origin: | |
| …then I’ll count backwards three units along the x-axis: | |
| …then I’ll count down one unit parallel to the y-axis: | |
| …and then I’ll draw my dot: |
ASSESSMENT
Suppose you were told to locate “(5, 2)” (pronounced as “the point five two” or just “five two”) on the plane. Where would you look? To understand the meaning of “(5, 2)”, you have to know the following rule: The x-coordinate (the number for the x-axis) always comes first. The first number (the first coordinate) is always on the horizontal axis.
Read our disclaimer.
AD: Take Free online baptism course: Preachi.com 